
(Download link at the end of this blog)
Monitoring Hyper-V

Microsoft Operations Management Suite capacity per VM overview needs SCOM
On a medium to large Hyper-V platform it can be difficult to get all your VM performance data at once and see all metrics per VM in a nice overview or dashboard. Especially when you want to quickly identify a urgent performance problem on your platform and not only want to pinpoint the problem at the host (hypervisor) level but also on the virtualized guest level. And in the case when customers report problems it would be nice to see how the guest itself is performing without having to ask credentials, logon to a unfamiliar OS and spent time gathering all data. Of course there is SCOM or other third-party monitoring tools, they can be really beneficial in regard to host and vmm monitoring level and less on the virtual machine level. Most of the time it also requires extra configuration displaying all VM data, especially in regard to a dashboard with metrics seen from inside as well as outside the guest. Metrics showing all the actual performance totals per resource (disk/nic/cpu) and thus lacking a comprehensive performance overview of all your VM’s. Another disadvantage is that you don’t want to wait for the next polling cycle and even in that cycle period may not register the actual performance at all. And especially when you’re in a smaller environment it may be too costly to go for a fully blown monitoring solution. An alternative for SCOM can be OMS (Microsoft Operations Management Suite), Microsofts new cloud-based monitoring system, it doesn’t require you to setup and update a complex monitoring platform, Microsoft already did that for you. At this moment it stil requires you to have your own SCOM environment if you want to monitor VM’s with OMS and still like SCOM it’s all about periodic measuring resource capacity and basic performance. Resulting (as of now) in an absent comprehensive and detailed per VM performance statistics overview.
PerfMon
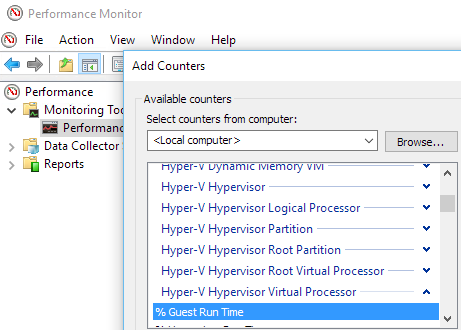
Hyper-V Guest PerfMon counters
Luckily there are CPU, Disk and Network guest performance counters for the Hyper-V VM. They can be added in ‘Performance Monitor’ aka ‘PerfMon’ on the Hyper-V host where the VM lives. You have to choose the VM from the list and add the relevant counters. By doing so you get real-time data per metric which give you a vague idea what is really going. That’s because you have to combine, translate, compare and interpret to real numbers and their averages to fully understand the situation on that particular host. Also you can’t parse the data and do any filtering or decent logging with it. So without configure a full blown SCOM solution or rely on costly third-party software it can be quite difficult to get comprehensive performance data from all your VM’s across different hosts in a nice overview. It would also be a big help if you could search and filter while troubleshooting an actual performance problem on your platform.
And like always here is where PowerShell comes into play! Combining the Hyper-V WMI Virtualization namespace VM and Disk information with the built-in PowerShell ‘get-counter’ cmdlet sampling and it’s possible to just do that!
A tool is born

Hyper-V VM Performance Monitor Tool GUI
So I wrote a Hyper-V VM performance script two years ago, it detected the Hyper-V hosts from AD and then invoked ‘get-counter’ against each host using the relevant guest counters. Of course you don’t want to wait until each ‘Get-Counter’ finished sampling so parallel processing was built with the help of PowerShell runspaces, it opens up a new PowerShell runspace/session where it executes ‘get-counter’ against each host. I never quite finished it as a useful tool for the community or even made it compatible with all kinds of imaginable scenarios outside my environment, until two months ago. I revamped the script, did a lot of testing with different client and server OS’es, gave it a GUI and spend time refactoring the code a bit. It’s not a fun job digging around in the PowerShell 2/3 version of you, therefore a piece of advice, throw a shot rewriting your code from scratch, if possible, don’t refactor, it will get messy. That said I persisted and published the script which transformed into a tool over time and published it on the TechNet gallery here for anyone to use. Basically it discovers and allows you to add Hyper-V hosts via a GUI, by hitting the ‘Monitor’ button it monitors all virtual machines running on the Hyper-V hosts for performance statistics in the specified time frame. All statistics are reported in a GridView when finished. This report contains all performance statistics based on CPU, Mem, Disk and NIC metrics, as seen in the screenshots below. Export to CSV is also possible by specifying the ‘-ExportToCSV’ parameter or even better return all objects to the console with the ‘-PSobjects’ parameter for further processing like periodically logging the data to SQL or just for your own filtering and troubleshooting needs.
On top of that it’s also possible to monitor a headless Nano server or Windows 10. Monitoring Hyper-V Containers (VM’s) is also an feature I’m considering to incoperate in the tool. But because of a different WMI classes and properties that wil cost me some time so vote for it in the TechNet Q/A section and I will prioritize it accordingly.

GridView report after monitoring Hyper-V hosts.
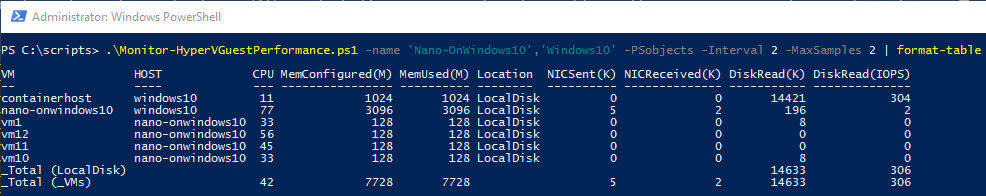
Skipping the GUI and return PSobjects instead of a Gridview report. Format-Table wraps it up to 10 columns.
Feedback
I really like to hear what you think, if you have suggestions or run into any kind of bug then send me a message in the Q/A part of the script on TechNet. I try to respond as fast as possible and help you out. There are already some requested features implemented in the Tool which were asked by users in the Q/A section so give it a shot and I will try to catch it. Please note that all performance metrics gathered with this tool are done from the Hyper-V VM perspective only and used to identify virtual machine (guest) performance. Other metrics outside Hyper-V virtualization like storage or cluster components are not within the scope of this project yet. Head over to the TechNet gallery script page for the latest version and updated documentation. I would like to thank Darryl van der Peijl reviewing and contributing to this tool, as always Darryl was a big help and also an active toolmaker, check out his ‘Windows Server Container Manager‘.
Download: Hyper-V VM Performance Monitor Tool in the TechNet Gallery
Link: YouTube video demonstration, remote monitoring Nano Hyper-V Server using nested virtualization on Windows 10 with Hyper-V installed.